Over the past decades, East Asia has been the most successful region in the world in building up cross-border supply chains and has subsequently become described as “Factory Asia” (Baldwin 2008). In a form of “triangle trade”, advanced countries in East Asia exported sophisticated parts and components to less developed countries in the region, where these are assembled into final consumption goods and then shipped to rich-nation markets, especially the US and EU (Baldwin and Kawai 2013).
These relationships are reflected in the structural composition of East Asia’s trade and could be discerned via the UN Broad Economic Categories classification, where exports are divided into four broad commodity groups:
- Primary goods, including food and beverage, fuel, lubricants, and primary industrial supplies for industry
- Intermediate goods, including processed goods mainly for industry and parts, components for capital goods and transport equipment
- Capital goods, including machinery and equipment used by producers as inputs for production
- Consumption goods, including durable and non-durable household goods as well as non-industrial transport equipment, such as automobiles
East Asia’s changing export composition
In a recent paper (Helble and Ngiang 2014) we document a structural transformation in the composition of East Asia’s trade over the past decade. As expected for Factory Asia in 2012, intermediate goods accounted for more than 50% of all East Asia’s exports and almost 60% of these are exported to economies within the region. From 1999 to 2012, this pattern deepened. The region’s intermediate good exports (in current dollars) expanded almost four-fold and the intra-regional share of these exports increased from 50% to almost 60%.
The other remarkable trend is the growth and destination of East Asia’s exports in consumption goods. The global financial crisis and subsequent economic crisis in the US and EU marked a significant slowdown in exports of consumption goods by East Asian economies towards these markets. At the same time, East Asia has considerably expanded consumption good exports towards markets within the region and the rest of the world. Whereas in 1999/2000 about 60% of all consumption goods exported by East Asia went to the US and EU, in 2011/12 this share fell to around 40%. Today, about 30% of the consumption goods are exported within the region and another 30% to the rest of the world. We can summarise that while Factory Asia has been resilient, the changing destinations of the region’s consumption good exports indicate that the triangle trade pattern has started to erode.
From global factory to global mall
In order to gauge the reorientation of East Asia’s export beyond a simple analysis of export volumes and destinations, we propose a new quantitative tool which measures how far East Asia’s exports ‘travel’ every year.
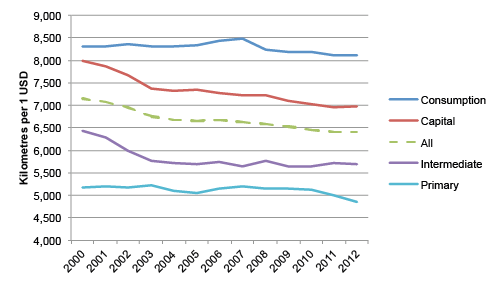
Figure 1. Average distance travelled by East Asia’s exports (2000 to 2012)

Source: Authors’ calculations using UN Comtrade and CEPII data. Note: As of August 2014, only about half of the world economies have reported their 2013 trade data via UN BEC Classification.
Looking at Figure 1, the first obvious observation is that the average distance travelled by each commodity type increases with the stage in the production chain. Whereas primary and intermediate goods are shipped over the shortest distances, capital and consumption travel furthest. Studying the evolution over time, we observe that the average distance for primary goods was relatively stable for most the time period. However, East Asia’s trade in intermediate goods fell until 2004 and has been relatively stable since then. In addition, more and more capital goods stay in the region and supply the Factory Asia with the necessary equipment.
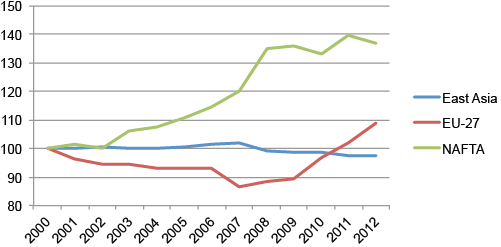
East Asia as the ‘global factory’ is evident by the distance travelled by consumption good exports. Over the last decade, East Asia’s consumption good exports travelled on average over 8,000 km before reaching their final markets. However, there are signs that East Asia as the global factory may be an evolving reality. In the aftermath of the Global Crisis, the distance travelled by East Asia’s consumption good export has declined by 4.4%. In contrast, the same measure for the EU and NAFTA has risen by 25.9% and 13.7% respectively (Figure 2). These changes are due to East Asia’s increasing share as a destination market for the world’s consumption good exports.
Figure 2. Average distance travelled of consumption goods (export by region, base=2000)

Source: Authors’ calculations using UN Comtrade and CEPII data.
A decreasing bias in consumption exports
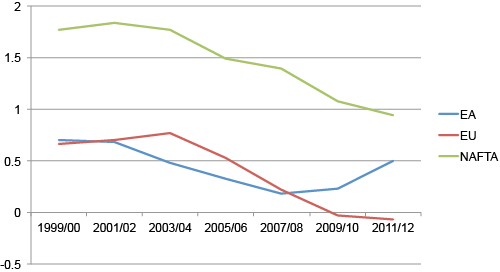
In order to know how trade patterns change over time, we run separate biannual gravity regressions on consumption goods exports with regional dummies for trade flows to the EU, NAFTA or East Asia. The regional dummies for East Asia’s exports to the EU and NAFTA exhibit a falling tendency, especially after 2003/2004, and reaffirm our hypothesis of a structural shift in East Asia’s export pattern.
Figure 3. Magnitude of regional dummy variables in biannual gravity regressions on East Asia’s consumption goods exports

Notes: All regional dummies of EU and NAFTA are highly statistically significant, except for the years 2009/2010 and 2011/2012 for the EU.
The driving forces
The rebalancing of exports of global consumption goods towards East Asia as a final market is driven by factors external in the global economic environment as well as internal to the region. Externally, the Global Crisis appears to be have dramatically accelerated the rebalancing of the world economy towards East Asia. Depending on whether the EU and NAFTA economies can extricate themselves from stagnation and resume sustained growth, the pace of the rebalancing towards East Asia may intensify or dampen.
Internally, decades of rapid economic growth in East Asia and Asian regionalism has led to rising income levels, expanding markets and falling trade costs. Barring the outbreak of armed conflict over territorial disputes or a profound economic shock, it is expected that these trends will persist.
The implications for East Asia
As East Asia evolves towards becoming the global mall, at least two major benefits for the region’s economies can be postulated.
First, East Asia will capture an increasing share of global production of high value-added downstream value chain activities such as distribution, marketing and customer services, which have been traditionally undertaken in major final markets, such as the EU and NAFTA. The iPhone value chain aptly illustrates this pattern. Although the iPhone is predominantly manufactured in East Asia and exported to final markets all over the world, Factory Asia captures only a relatively small fraction of the value added (about 18%) derived from iPhone sales (Xing and Detert 2010; Inomata 2013). As East Asia matures as an end consumer market, it is most likely that the region will capture an increasing share of global production value added.
Second, the average lead times for East Asia’s exports to reach end-consumers will fall. Increased exports to nearer destinations translate into lower transportation and inventory costs and eventually higher margins for companies or lower prices for consumers. For example, it currently takes about a month for newly assembled automobiles to be shipped from Japan to the US, which implies substantial transportation and inventory costs. It is partly due to these costs that Japanese automakers have found it financially worthwhile to locate a significant number of plants in the US (Financial Times 2014). As East Asia grows in importance as a final market, for industries like the automobile industry, which produces goods that are logistically challenging to export, it would also mean that more final assembly activities are likely to take place in the region.
Conclusion
East Asia remains the ‘global factory’ and due to its economic size and dynamic economic development is also on its way to become the global mall. The region is expected to benefit from this evolution via capturing an increased share of global production of high value-added activities as well as reduced trade costs. These two consequences could be expected to further enhance economic growth of East Asia and further accelerate the region’s transformation into a global mall. However, this transformation will only be possible if East Asia continues on its current trajectory of peaceful and sustained economic growth.
_____
References:
Baldwin, R. 2008. Managing the Noodle Bowl: The Fragility of East Asian Regionalism. Singapore Economic Review, Vol. 53, No. 3, 449-478.
Baldwin, R., and M. Kawai. 2013. Multilateralizing Asian Regionalism. ADBI Working Paper 431. Tokyo: Asian Development Bank Institute.
Financial Times. 2014. Honda Becomes Net Exporter of Cars from the US. 28 January.
Helble, M., and B. Ngiang. 2014. From Global Factory to Global Mall: East Asia’s Changing Trade Composition. ADBI Working Paper 496. Tokyo: Asian Development Bank Institute.
Inomata, S. 2013. Trade in Value Added: An East Asian Perspective. ADBI Working Paper 451. Tokyo: Asian Development Bank Institute.
Kawai, M., and G. Wignaraja. 2008. EAFTA or CEPEA: Which Way Forward? ASEAN Economic Bulletin, Vol. 25, No. 2, 113–139.
This article was first published by the voxEu Blog.


Comments are closed.